Sydney IT Training • Career-Ready Programs • Industry-Focused Learning
Book Consultation
Home IT Training Sydney Data Analytics Training Sydney
Practical Data Analytics Training Sydney

Learn to Turn Raw Data Into Useful Business Insight.

Build practical data analytics capability across data preparation, spreadsheets, SQL, analysis, visualisation, dashboards, reporting and communicating insights.

IT Launchpad helps students, graduates, career changers and professionals develop a more practical understanding of how data moves from a spreadsheet or database into information that people can use to understand performance and make better decisions.

Data foundations
Analysis & visualisation
Business reporting
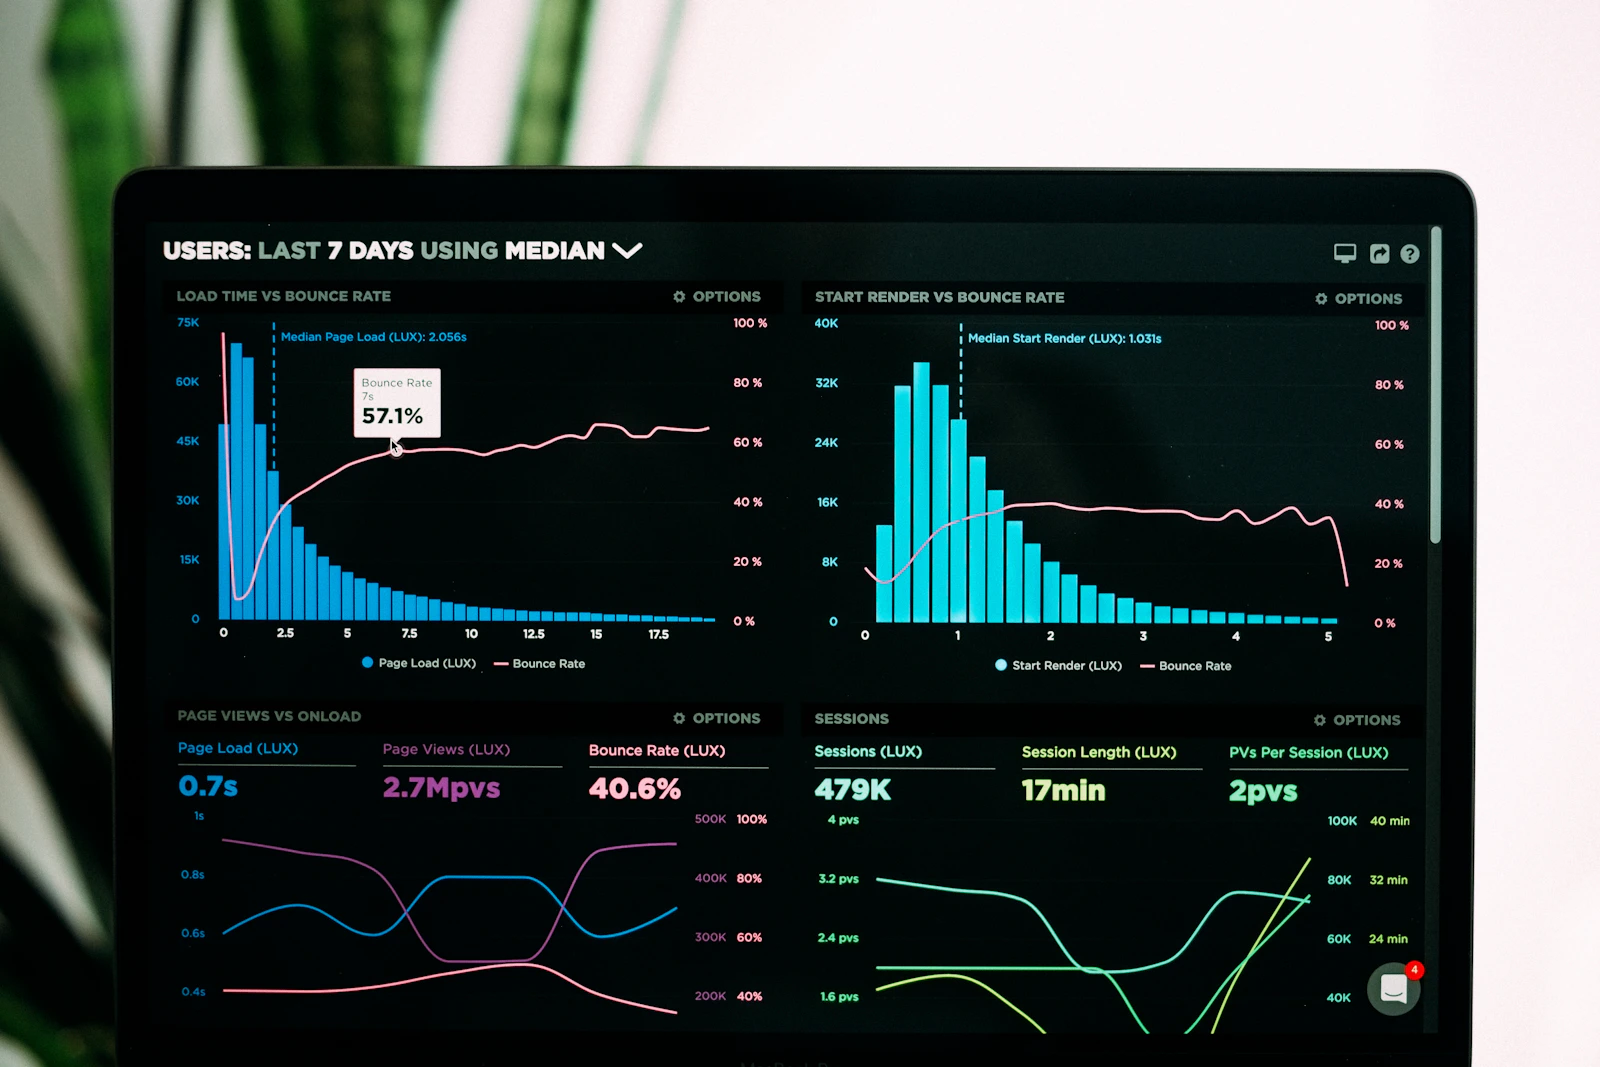
Analytics dashboard showing charts and performance data
Data-to-Decision Map Prepare → Analyse → Explain
Collect
Clean
Query
Visualise
Explain
What Is Data Analytics Training?

A Dashboard Is the End Product. The Real Work Starts With the Data.

Organisations collect information through transactions, websites, customer interactions, business systems, operations, surveys, finance platforms and many other sources. Having data, however, does not automatically mean having useful insight.

Before information can support a decision, someone needs to understand what the data represents, check its quality, organise it correctly, analyse it and communicate the result in a way other people can understand.

IT Launchpad's Data Analytics Training Sydney pathway is designed around that end-to-end analytical process.

Rather than treating analytics as simply creating attractive charts, the learning should help you understand how to move from a business question to relevant data, from raw information to analysis and from analysis to a meaningful conclusion.

Data analytics also connects naturally with Business Analysis Training Sydney. Business analysts often help define problems, requirements and processes, while data analysts use data to explore patterns, measure outcomes and support evidence-based understanding.

Learners interested in the next generation of data-driven technology can also explore AI Training Sydney, while broader professional preparation is available through the Career Ready Program and IT Internship Sydney.

Good analytics does not begin with “Which chart should I use?”

It begins with a better question: what are we trying to understand, what data can help answer that question and what evidence would genuinely support the conclusion?

Data Analytics Foundations

Build the Thinking Behind Useful Data Analysis.

Analytics is not simply a software skill. You need to understand the question, the data, the analysis and the people who will use the result.

Ask the Right Question

Define what the organisation is trying to understand before analysing large amounts of information without a clear purpose.

Understand the Data

Learn what fields, records, categories, dates and measures actually represent before drawing conclusions from them.

Prepare the Data

Identify missing information, duplicates, inconsistent formats and other issues that may affect analysis quality.

Analyse Patterns

Compare results, investigate variation and identify patterns that may help explain what is happening.

Visualise Clearly

Choose charts and dashboard elements that make information easier to understand rather than simply making reports look impressive.

Explain the Insight

Communicate what the analysis shows, what it does not show and why the result matters to the people making decisions.

Inside Data Analytics Training

Build Practical Analytics Skills Across the Data Workflow.

Develop the ability to organise, query, analyse, visualise and explain data rather than learning individual tools without understanding the purpose behind them.

01 Data Literacy

Understand what the data actually represents.

Before performing calculations, an analyst needs to understand the structure and meaning of the information. A number without context can easily be misunderstood.

Data literacy develops your ability to recognise different types of information, understand measures and categories and ask whether the available data is suitable for the question being investigated.

  • Data types
  • Rows, columns and records
  • Measures and dimensions
  • Analytical questions
02 Spreadsheets

Use spreadsheet data more systematically.

Spreadsheets remain an important analytical environment because many businesses store, exchange and inspect information through tabular files.

Practical spreadsheet skills can help analysts organise data, calculate measures, summarise results, explore patterns and validate information before moving into larger analytical environments.

  • Data organisation
  • Formulas and calculations
  • Filtering and summarising
  • Analytical tables
03 SQL & Querying

Learn how analysts retrieve the data they actually need.

Business data is often stored across structured systems rather than one convenient spreadsheet. Query skills help analysts retrieve relevant records and combine information in a more controlled way.

SQL concepts are particularly valuable because they develop an understanding of filtering, grouping, relationships and how structured data can be queried to answer business questions.

  • Tables and fields
  • Filtering data
  • Grouping and aggregation
  • Data relationships
04 Data Cleaning

Learn why analysis quality depends on data quality.

Real-world data is rarely perfectly prepared. Dates can be inconsistent, categories may use different names, records may be duplicated and important values may be missing.

Analysts need to identify these issues before trusting the output of a calculation, chart or dashboard.

  • Missing values
  • Duplicate records
  • Format consistency
  • Quality checking
05 Analysis

Move from summarising data to understanding what it means.

Analysis can involve comparing groups, measuring change, examining distributions, finding unusual results and looking for relationships that help explain business performance.

The goal is not simply to produce more calculations. It is to identify which analysis helps answer the question that matters.

  • Summary measures
  • Comparisons
  • Trends and variation
  • Analytical interpretation
06 Visualisation

Choose visuals that make the information easier to understand.

A chart should help someone see an important pattern more quickly than they could by reading a table of numbers.

Practical visualisation training should therefore focus on choosing the appropriate visual, reducing unnecessary clutter and making comparisons easier to interpret.

  • Chart selection
  • Trend visualisation
  • Clear comparisons
  • Visual clarity
07 Dashboards

Build reports around the questions people need answered.

A dashboard should not become a collection of every number available. Good reporting focuses attention on the information that matters to the intended audience.

Business intelligence tools can support interactive reporting, but effective dashboards still depend on good data, appropriate measures and thoughtful design.

  • KPI thinking
  • Dashboard structure
  • Interactive reporting
  • Business intelligence concepts
08 Communication

Explain the analysis to people who were not involved in creating it.

A technically correct analysis has limited value when the audience cannot understand the conclusion or determine what it means for the business.

Analysts therefore need to explain context, highlight the important findings, communicate limitations and avoid overstating what the data actually proves.

  • Insight communication
  • Data storytelling
  • Presenting findings
  • Explaining limitations
Think Like a Data Analyst

Start With the Question. Finish With Something People Can Actually Use.

Analytics becomes more valuable when you treat it as a complete process rather than jumping directly into a dashboard or software tool.

01

Define

Understand the business question and identify what decision or problem the analysis needs to support.

02

Prepare

Gather relevant data, understand its structure and resolve quality issues that may affect the analysis.

03

Analyse

Explore the information, calculate relevant measures and investigate patterns related to the original question.

04

Visualise

Present the important information using charts, tables and dashboards appropriate to the audience.

05

Explain

Communicate the insight, its limitations and why the result matters to the organisation.

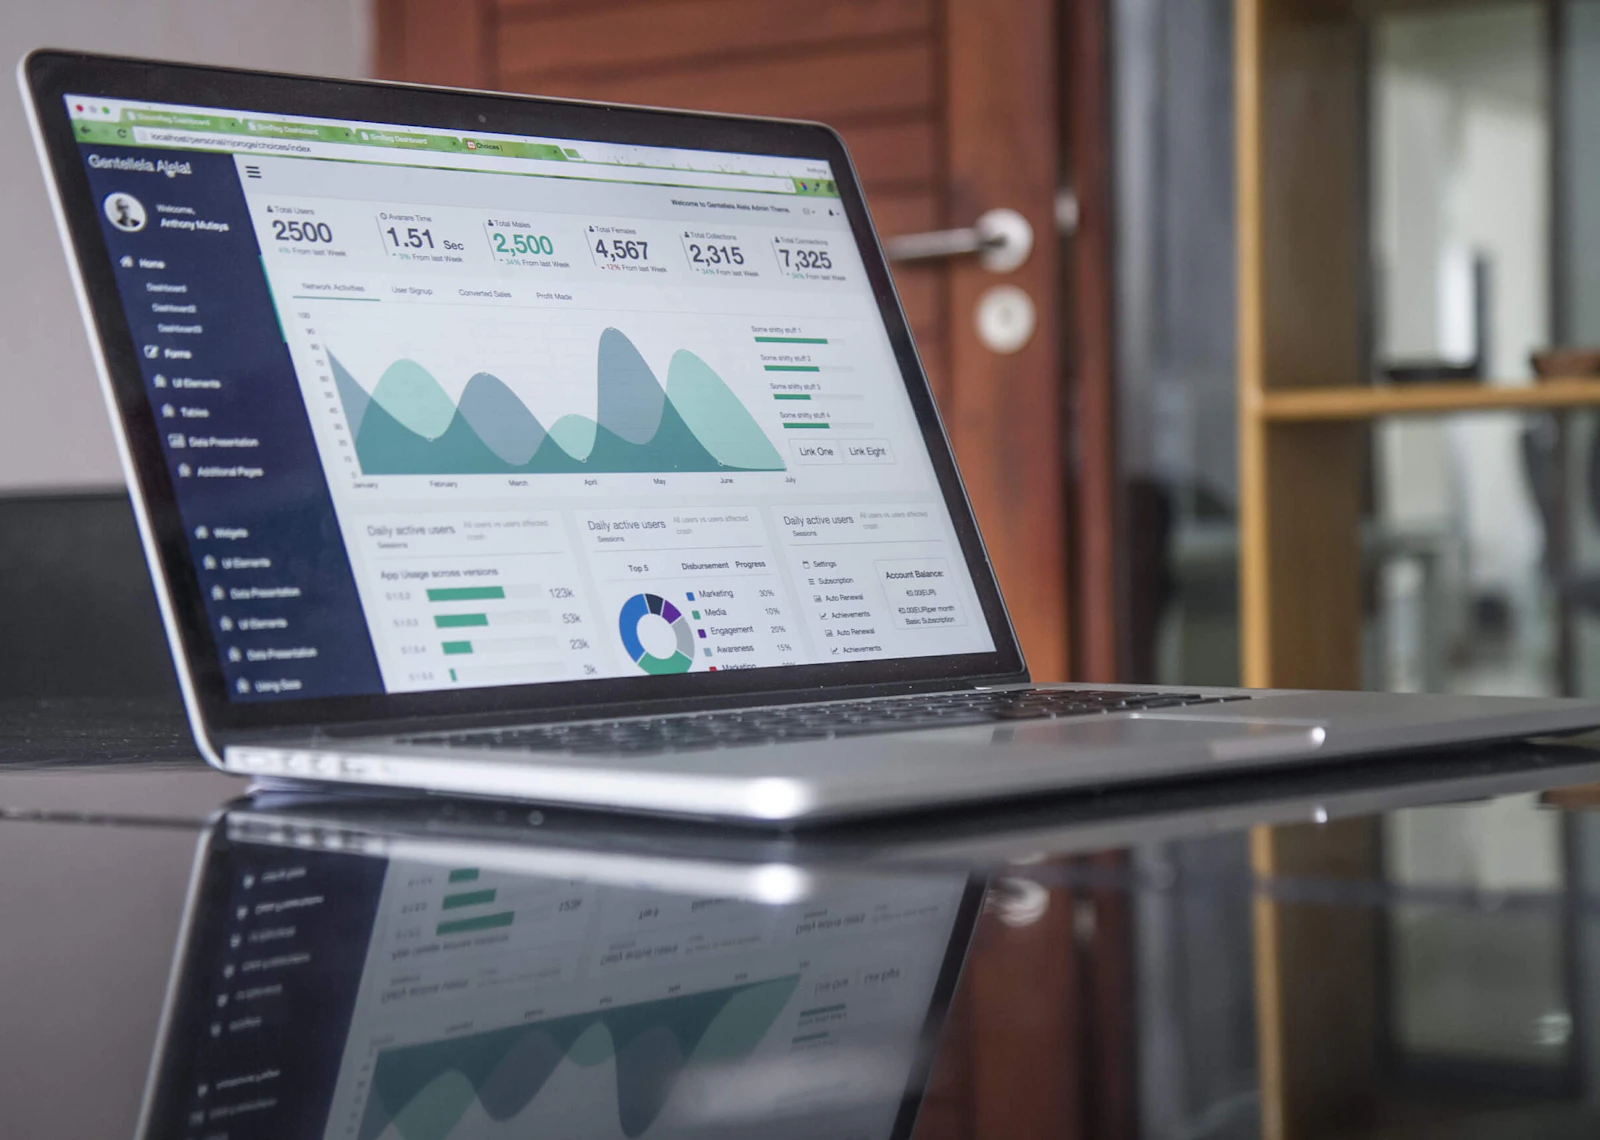
Laptop displaying business analytics charts and dashboard information
Analytics Is About Decisions

The most impressive dashboard is useless if nobody knows what to do with it.

Data analysts operate between raw information and business understanding. That means technical capability is only one part of the role.

You also need to understand what stakeholders are asking, determine whether the available data can answer the question and explain your findings without making the analysis more complicated than it needs to be.

This is why data analytics connects naturally with business analysis, communication and broader career-ready skills.

Explore Business Analysis Training
Practical Analytics Capability

Do More Than Follow a Dashboard Tutorial.

Practical analytics capability means being able to approach unfamiliar information and work logically towards an answer.

01

Question

Translate a broad business concern into something that can be investigated with data.

02

Prepare

Organise and check information before assuming the dataset is ready for analysis.

03

Investigate

Compare information, identify patterns and test whether the data supports your initial assumptions.

04

Communicate

Turn the analysis into a clear message appropriate to the people who need to use it.

Who Is Data Analytics Training For?

Build Data Capability From Different Professional Backgrounds.

IT & Data Graduates

Strengthen practical analytics capability beyond academic theory and become more confident working through realistic data problems.

Current Students

Complement formal study with practical experience working with structured information, analysis and business reporting.

Business Professionals

Develop stronger capability interpreting operational, customer, financial or performance information in your existing role.

Business Analysis Learners

Add data capability to broader requirements, process and stakeholder-focused business analysis skills.

Career Changers

Build analytical foundations while exploring whether data, reporting or business intelligence aligns with your strengths.

Professionals Upskilling

Improve your ability to work with data as analytical responsibilities become more important in technology and business roles.

Data Analytics Career Directions

Data Skills Can Support Different Analytical Careers.

The tools and depth required vary by employer, but practical analytics foundations can support several data and business-oriented career directions.

Direction 01

Data Analyst

Work with structured data to investigate questions, identify patterns and communicate useful findings.

Direction 02

Reporting Analyst

Build and maintain reporting that helps teams understand operational or business performance.

Direction 03

Business Intelligence Analyst

Connect data preparation, modelling, reporting and dashboards with business decision support.

Direction 04

Operations Analyst

Use data to understand processes, service performance, efficiency and operational outcomes.

Direction 05

Business Analyst

Combine analytical evidence with process, requirements and stakeholder capability through further business analysis development.

Direction 06

Analytics-Enabled Professional

Apply stronger data capability inside marketing, finance, operations, technology or other business functions.

Build Your Data Career Pathway

Learn the Tools. Then Learn How to Apply and Explain Them.

Focus your learning

IT Bootcamp

Use more concentrated learning when you want to build capability around a specific technology direction.

Explore IT Bootcamp →
Develop workplace context

IT Internship

Build broader understanding of professional technology environments, teamwork, communication and workplace responsibilities.

Explore IT Internship →
Strengthen your positioning

Career Ready Program

Connect your technical projects with career direction, resume, LinkedIn and interview preparation.

Explore Career Ready →

Need data analytics or reporting training for your business team?

Organisations can explore Corporate IT Training Sydney for workplace-focused data analytics, AI, cloud, cyber security and broader technology capability development.

Corporate IT Training
Your Data Analytics Learning Path

Build the Foundations Before Trying to Become an Expert in Every Analytics Tool.

Strong analytics capability begins with understanding data and analytical thinking. Tools become far more useful once those foundations are in place.

01

Understand Data

Build confidence with datasets, fields, measures, categories and analytical questions.

02

Prepare & Query

Learn how to organise, clean and retrieve the information relevant to a question.

03

Analyse

Explore patterns, comparisons, trends and results using appropriate analytical methods.

04

Visualise

Turn important findings into clearer charts, reports and dashboards.

05

Communicate

Explain the insight and connect analytical results with business questions and decisions.

Data Analytics Training Sydney

Practical Data Skills for Modern Business and Technology Careers.

Data Analytics Training in Sydney for Students, Graduates and Professionals

Data analytics is the process of turning information into useful understanding. Businesses generate increasing amounts of data, but the value comes from being able to organise that information, investigate it and explain what the results mean.

IT Launchpad's data analytics training in Sydney is designed around the complete analytical workflow rather than one individual software package.

Learners develop foundations across data preparation, spreadsheet analysis, querying, visualisation, dashboards and communicating findings.

Excel and spreadsheet skills for data analytics

Spreadsheets remain widely used for business reporting and analysis because they provide a flexible environment for organising, calculating and reviewing information.

For aspiring analysts, spreadsheet capability can provide an accessible starting point for understanding data structure, calculations, filtering, summaries and analytical logic.

The deeper objective should not be memorising hundreds of formulas. It should be developing the ability to choose an appropriate method for the business question you are trying to answer.

SQL training for data analytics

As datasets become larger and information is stored across structured systems, analysts often need ways to retrieve relevant records efficiently.

SQL concepts help learners understand how data can be selected, filtered, grouped and combined from structured tables.

Querying is especially valuable because it teaches analysts to think deliberately about which information is actually required rather than exporting every available field and attempting to understand it afterwards.

Data cleaning and preparation

One of the biggest differences between classroom examples and real-world analytics is data quality. Training examples may arrive perfectly organised, but operational data can contain missing values, duplicate records, inconsistent labels and unexpected formats.

Analysts therefore need to learn how to inspect data carefully before trusting the output.

Data cleaning is not simply a preliminary inconvenience. It is part of analytical quality because incorrect or inconsistent data can produce convincing but misleading results.

Data visualisation training Sydney

Data visualisation helps people understand information more quickly. A good visual can reveal a pattern that might be difficult to recognise from hundreds of rows in a spreadsheet.

However, choosing a chart should depend on the message. Trends, comparisons, composition and relationships may require different approaches.

Effective visualisation therefore combines technical capability with judgement about how information should be presented.

Dashboard and business intelligence training

Dashboards are commonly used to monitor performance and make frequently requested information easier to access.

But a dashboard should not contain every metric simply because the data is available. Analysts need to understand which measures are relevant to the audience and how those measures relate to organisational objectives.

Business intelligence tools can support dashboard development and interactive reporting, but the quality of the result still depends on data preparation, analytical logic and communication.

Power BI and analytics tools

Tools such as Power BI are commonly associated with modern reporting and data visualisation. The specific software included in a training program should always be confirmed with IT Launchpad before enrolment.

More importantly, learners should develop transferable concepts around data preparation, relationships, measures, visualisation and reporting so their capability is not limited to memorising one interface.

Python and data analytics

Programming can become useful as analytical tasks become more complex or repetitive. Python is one example of a language commonly associated with data analysis and automation.

However, learners do not need to begin by trying to master every programming library. The right technical depth depends on the analytical role and the type of work being performed.

Data analytics vs business analysis

Data analytics and business analysis overlap but are not identical.

A data analyst may focus heavily on datasets, metrics, patterns, reports and analytical evidence. A business analyst may spend more time understanding business problems, processes, stakeholders and requirements.

The two areas can complement each other. Learners interested in the business-facing side of technology can explore Business Analysis Training Sydney.

Data analytics and artificial intelligence

Data and artificial intelligence increasingly connect, but analytics and AI should not be treated as the same discipline.

Analytics typically focuses on understanding existing data and producing useful insight. AI can involve systems designed to generate, classify, predict, automate or support other forms of intelligent processing.

Learners interested in this next step can explore AI Training Sydney.

Data analytics bootcamp Sydney

Learners seeking a more focused learning pathway can explore IT Bootcamp Sydney.

A concentrated analytics pathway may be useful when you already understand your career direction and want to focus practical development around data preparation, analysis and reporting.

Data analytics internship Sydney

Technical analytics training develops analytical capability. Workplace experience develops additional understanding around communication, priorities, stakeholder expectations and the way analytical work fits into an organisation.

Learners seeking broader workplace exposure can explore IT Internship Sydney.

Building a data analytics portfolio

Analytical projects can help candidates demonstrate how they think rather than simply listing software names on a resume.

A useful project should make the analytical process clear: what question were you investigating, what data did you use, how did you prepare it, what analysis did you perform and what did the results show?

Being able to explain these decisions can be as important as showing the final dashboard.

Preparing for data analyst interviews

Data analytics interviews may require candidates to explain analytical projects, SQL concepts, reporting decisions, data-quality issues or how they would approach an unfamiliar business question.

IT Launchpad's Career Ready Program can complement technical analytics training with professional positioning, resume and LinkedIn development and interview preparation.

Corporate data analytics training Sydney

Data capability is also valuable for existing business teams. Managers, analysts and professionals increasingly need to interpret reports, understand dashboards and use business information more confidently.

Organisations can explore Corporate IT Training Sydney for workplace-focused data, analytics and broader digital capability development.

What careers can data analytics skills support?

Data analytics capability may be relevant to data analyst, reporting analyst, business intelligence, operations analysis and other roles where interpreting business information is important.

Actual job titles and technical requirements vary significantly between employers. Some positions may require stronger SQL, statistics, programming, data modelling or domain-specific knowledge.

Does data analytics training guarantee employment?

No legitimate training program can guarantee employment. Hiring outcomes depend on technical capability, practical experience, communication, previous background, competition and the requirements of each employer.

The purpose of practical data analytics training is to help you build stronger capability and become better prepared for further development and future opportunities.

Data Analytics Training Sydney FAQs

Questions About Learning Data Analytics in Sydney.

Build strong analytical foundations first, then develop deeper capability around the tools and career direction relevant to you.

What is data analytics training?

Data analytics training develops the ability to organise, prepare, analyse, visualise and communicate information so it can support understanding and decision making.

What does Data Analytics Training Sydney cover?

Training can include data literacy, spreadsheets, SQL concepts, data cleaning, analysis, visualisation, dashboards, reporting and communicating analytical insights.

Who is data analytics training suitable for?

It may suit students, graduates, career changers, business professionals, business analysis learners and existing professionals who want stronger data capability.

Do I need previous data analytics experience?

The appropriate starting point depends on the program level. Beginners can start by developing data literacy, spreadsheet and analytical foundations before moving towards more advanced querying and reporting.

Does data analytics training include Excel?

Spreadsheet skills are highly relevant to analytics. Contact IT Launchpad to confirm the exact tools included in the current training program.

Does data analytics training include SQL?

SQL concepts are valuable for understanding how structured data can be filtered, grouped and queried. Confirm the exact SQL depth in the current IT Launchpad training pathway before enrolment.

Does the training include Power BI?

Business intelligence and dashboard concepts are relevant to data analytics. Contact IT Launchpad to confirm whether Power BI or another specific platform is included in the current program.

Do I need coding skills to become a data analyst?

The required coding depth varies by role. Some analyst positions rely heavily on spreadsheets, SQL and business intelligence tools, while others may require programming skills such as Python.

Will I learn data cleaning?

Data preparation is an important analytical capability because missing values, duplicates and inconsistent formats can affect the reliability of analysis.

Will I learn dashboards and data visualisation?

Visualisation and dashboard concepts can help learners communicate analytical results more effectively and design reporting around the needs of the audience.

What is the difference between data analytics and business analysis?

Data analytics commonly focuses on analysing datasets and reporting insights, while business analysis often focuses more broadly on business problems, processes, stakeholders and requirements. Explore Business Analysis Training Sydney.

Is data analytics related to AI?

Data and AI are closely connected, but they are different disciplines. Explore AI Training Sydney for the dedicated AI and automation pathway.

What careers can data analytics skills support?

Data analytics skills may support development towards data analyst, reporting analyst, business intelligence analyst, operations analyst and other data-oriented roles. Employer requirements vary.

Can I become a business analyst after learning data analytics?

Data skills can be useful for business analysts, but business analysis also requires capability around stakeholders, requirements, processes and business change. Explore Business Analysis Training Sydney.

Is there a data analytics bootcamp in Sydney?

Learners looking for focused practical development can explore IT Bootcamp Sydney and discuss whether a data-focused pathway is suitable.

Can I combine data analytics training with an internship?

Technical training and workplace experience can complement one another. Explore IT Internship Sydney for workplace-focused development.

Can IT Launchpad help me prepare for data analyst interviews?

The Career Ready Program focuses on career direction, professional positioning, resume and LinkedIn development and interview preparation.

Do you provide data analytics training for businesses?

Organisations can explore Corporate IT Training Sydney for workplace-focused data analytics and wider technology skills development.

Does data analytics training guarantee employment?

No. Training develops capability, while employment depends on technical skills, experience, communication, available positions, competition and employer requirements.

How do I start Data Analytics Training with IT Launchpad?

Start by contacting IT Launchpad and sharing your current background, experience with data and the type of analytical or business role you want to work towards.

Do not just learn how to build charts. Learn how to find and explain the insight behind them.

Talk with IT Launchpad about your current background and the analytics career direction you want to explore. Build a clearer pathway across data analysis, business intelligence, business analysis, practical experience and career preparation.

Discuss Data Analytics Training